


Load Test Your API in 5 Easy Steps
Learn how to load test your APIs/website using k6 and prepare to scale to the moon! 🚀


Ever wonder how a billion dollar food delivery company's app crashes when it reaches 6000 orders per minute, but other companies are able to handle over 9000 per minute orders with ease? Or how a sports live streaming company prepares their infrastructure to handle 25 MILLION concurrent hitting their website like a tsunami at the start of a game?
There are a myriad of reasons, but one reason that is common in all of these scenarios - preparation. These companies perform extensive load testing to ensure all their APIs are fine-tuned to the last millisecond latency and their infrastructure can handle the load thrown at them without breaking a clock cycle.
To get started with performance testing let's learn how you can run a quick test using k6, an open-source load testing tool part of the Grafana Labs family.
1. Install k6
The first step is to install the k6 tool on your machine or the machine you want to run the performance test. For example, this can be an EC2 instance in your AWS Cloud infrastructure.
Follow the instructions in this link to install the k6 tool on the platform of your choice. For this example, I will be using Mac OS.
brew install k6
2. Create your load testing script
The next step is to create a load testing script which k6 can use. Think of this script like your user's behavior - like the action of visiting your website or invoking your API. What would your user's behavior? Which API's would this user invoke?
You can copy the script below to your machine where you have k6 installed and modify the ENDPOINT variable with your API endpoint URL. Also, k6 supports all the standard HTTP requests like GET, POST etc. Modify the http request type with the required parameters as per your API's specification, if required. The default function () is your user - this is the function k6 continuously calls as the load test progresses.
For this example I am using k6's demo website as the ENDPOINT.
import http from "k6/http";
import { sleep } from "k6";

const ENDPOINT = "https://test.k6.io";

export default function () {
  http.get(ENDPOINT);
  sleep(1);
}
You can find the same code in this Github repo. The script name is quickstart.perf.js.
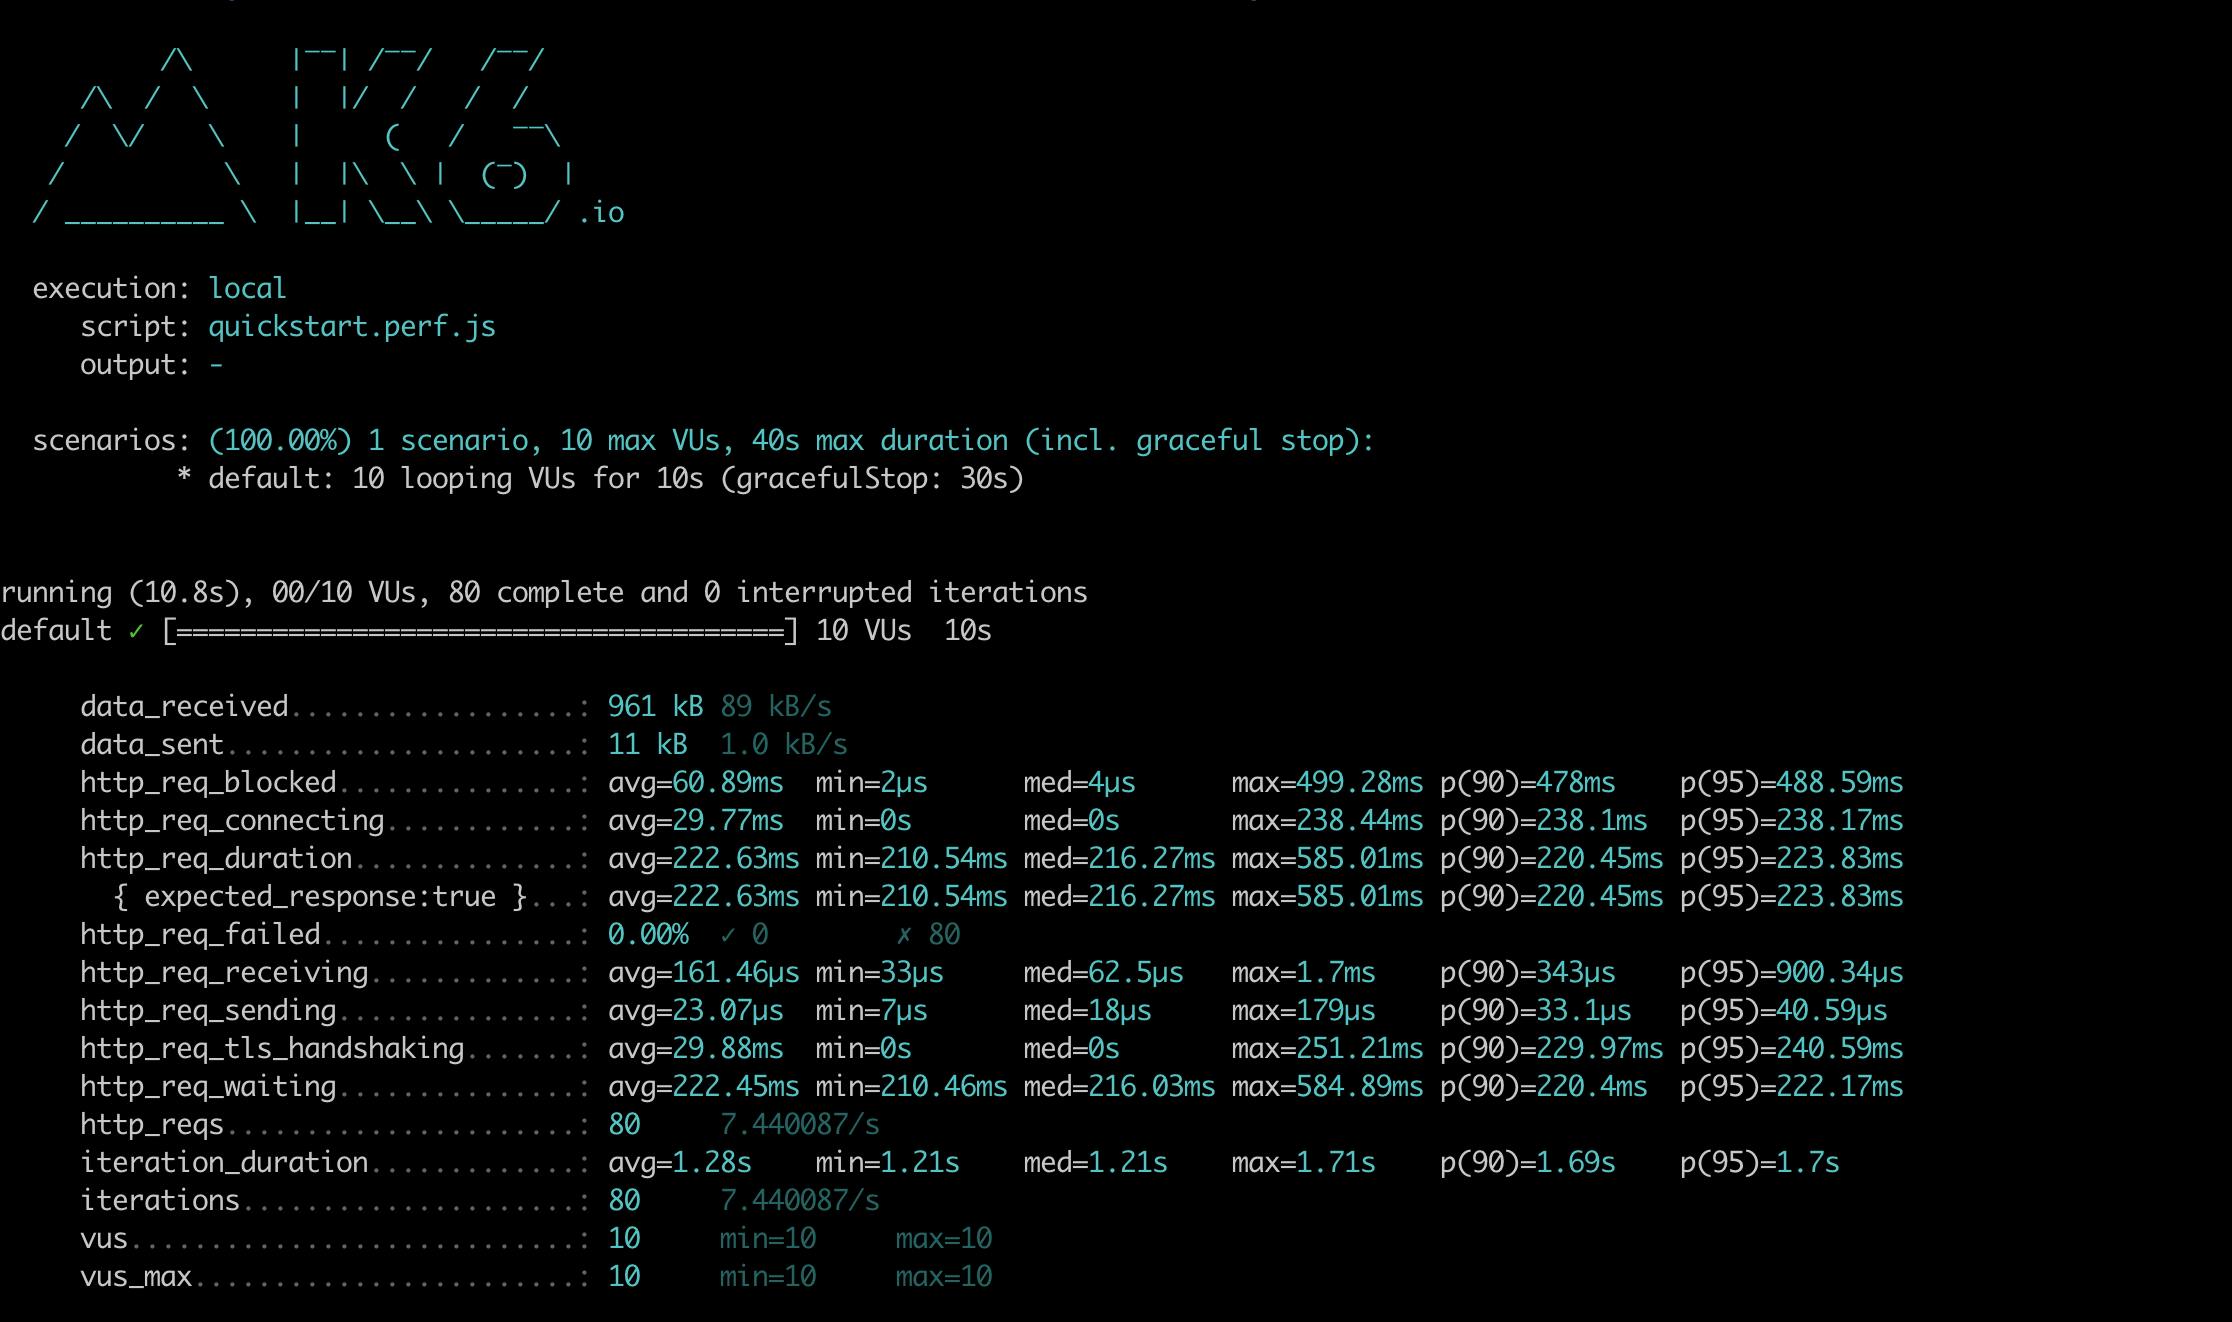
3. Run a quick sanity test
Now that we have k6 installed and have a load testing script ready, let's run a quick sanity test to make sure the scripts correctly.
We need to provide k6 with two command line parameters - the duration and the number of virtual users vus. The duration is pretty self explanatory - it's how long you want the test to run for. This can range from a few minutes to multiple hours. The virtual users or vus is one of k6's core components. Think of these virtual users as your users - like the people who are visiting your website or invoking your API.
For this sanity test let's start with a duration of 10 seconds and vus of 10, ie., 10 virtual users.
k6 --duration '10s' --vus 10 run quickstart.perf.js
If there are no errors, you should see something like:
4. Let's load test!
Okay, we have written our load testing script and even made sure the script works correctly. Let's go ahead and start our load test!
For this load test let's use a duration of 10 minutes and vus of 100, ie., 100 virtual users.
k6 --duration '10m' --vus 100 run quickstart.perf.js
You can run tests with a higher number of vus and a larger duration depending on the traffic your API or website receives.
5. Analyze the results
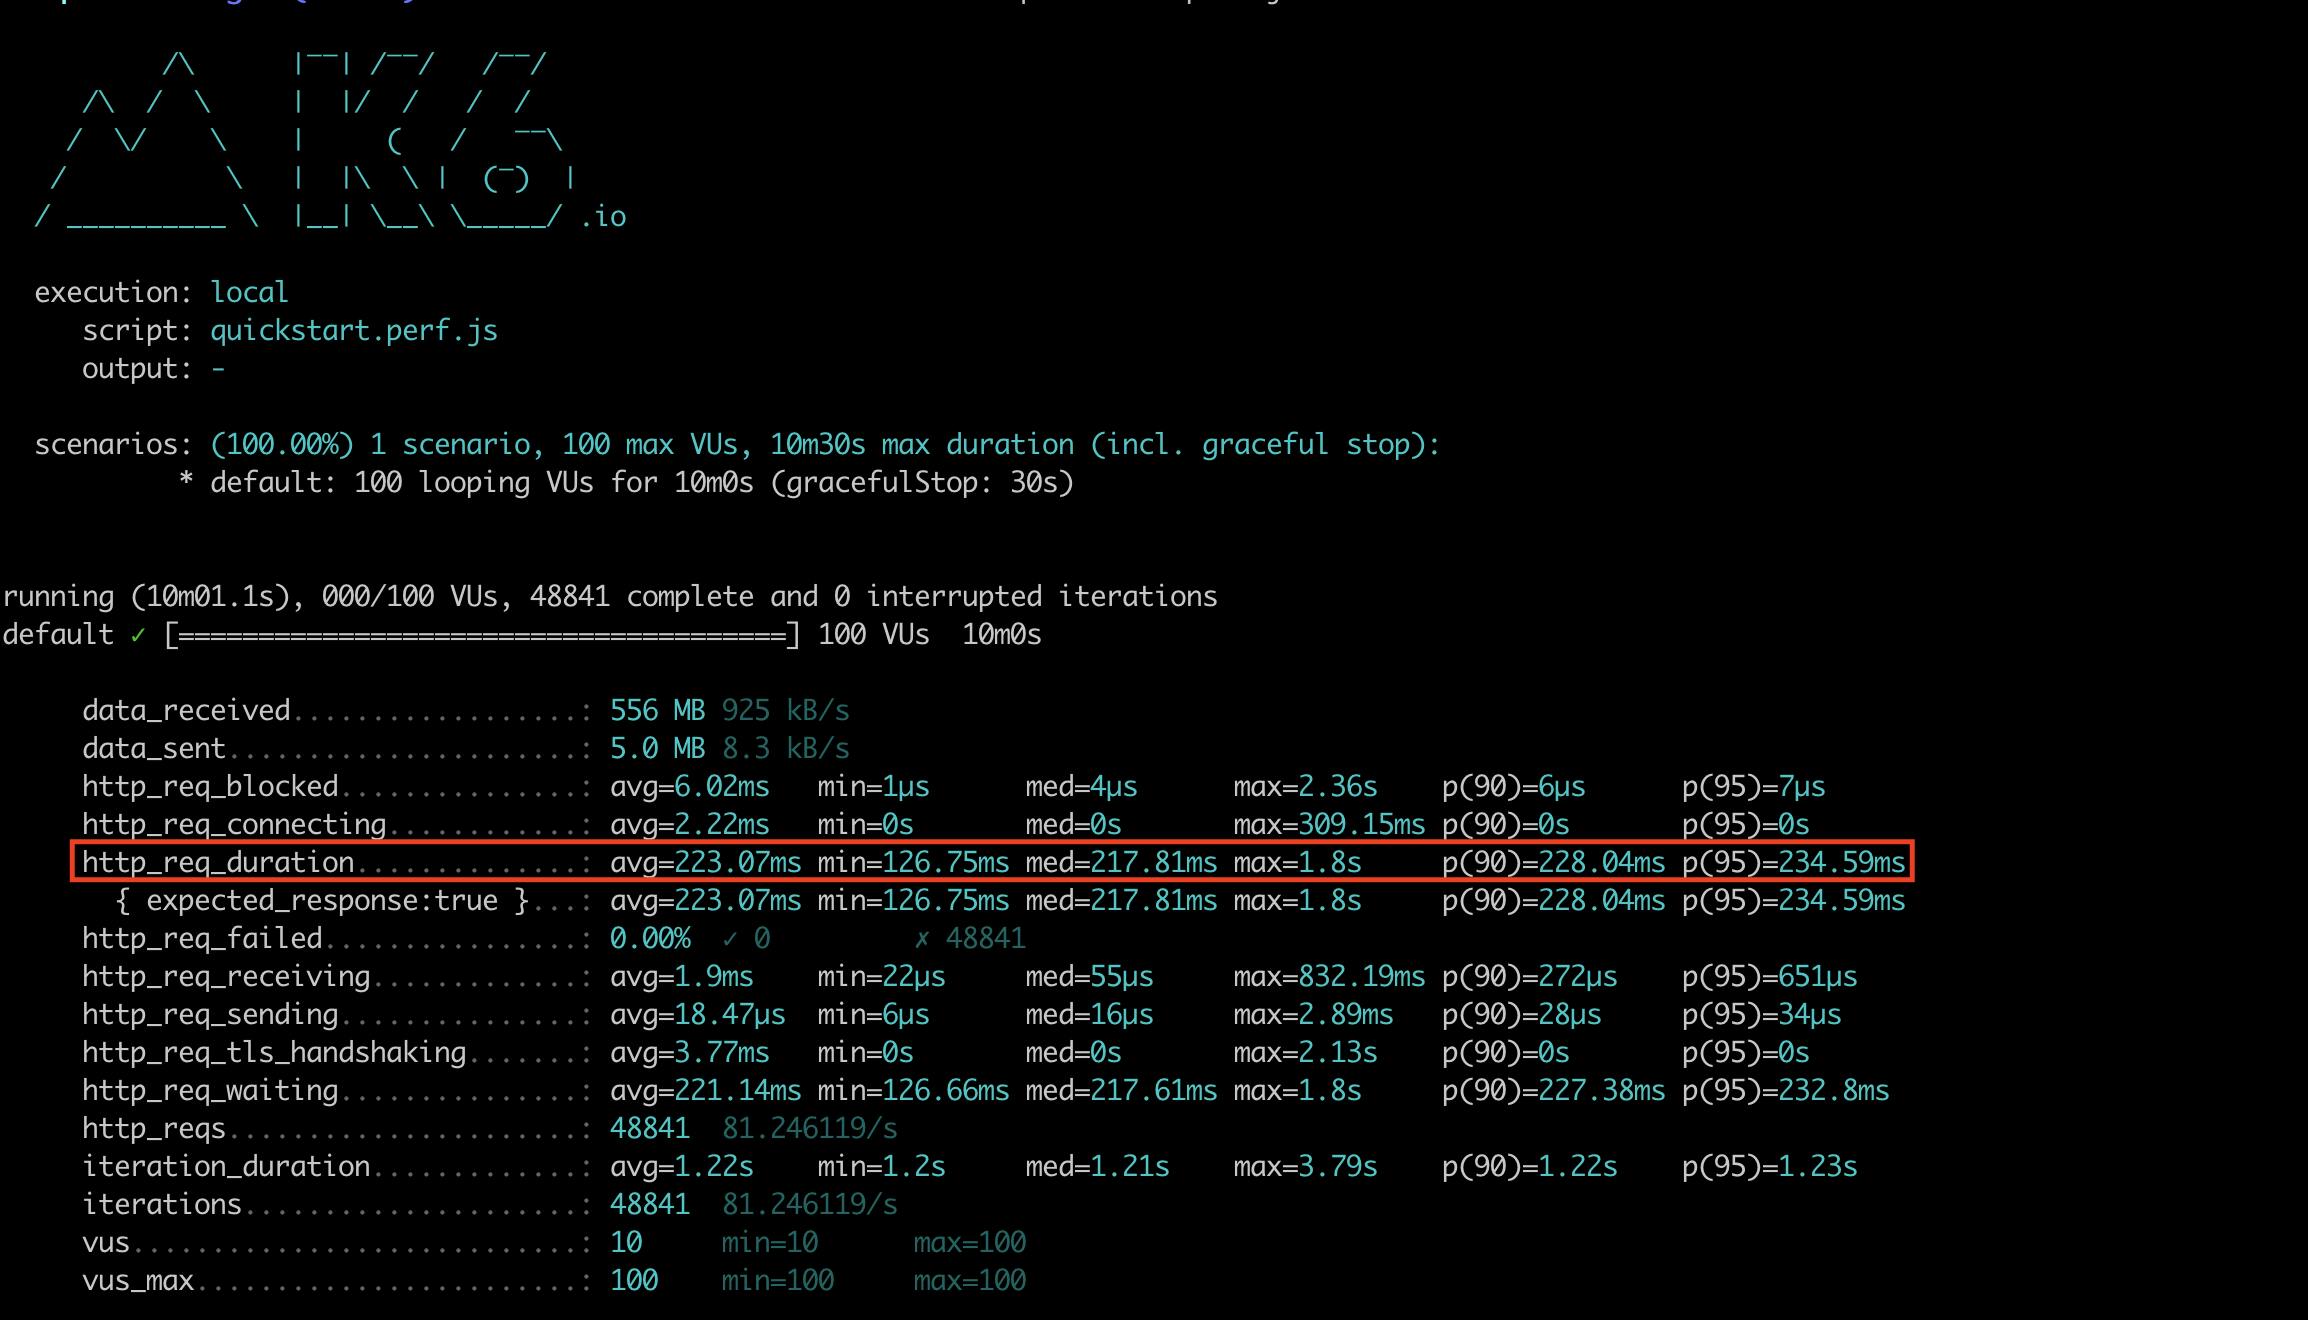
Once the load test is completed, let's have a look at the results. Particularly, let's look at the http_req_duration metric, which is the overall response time. What are some of the insights we can observe?
The average response time is 233.07 ms in this load test. In a hypothetical scenario, let's say your average response time for build A was below 100 ms. You make some changes and release build B. You repeat the same load test with build B and observe the average response time has doubled to over 200 ms! Now you will immediately know there is something wrong with build B and can fix this issue before deploying this change to your customer base.
Another metric which is important to check are the percentile distributions of the response times - specially the p(90) and p(95) which stand for the 90th percentile and 95th percentile respectively. The percentile distribution gives you a benchmark of your API's/websites's response time at that percentile. For example, let's say the 90th percentile of response times for your API is 100 ms. This means 90% of queries have a response time lesser than 100 ms, and only 10% of queries have a response time greater than 100 ms.
Averages are skewed by large outliers and percentiles help you catch those outliers. In this load test the average is 233.07 ms and the p(95) is 234.59 ms, which means there are no large response times skewing the average - this shows the response times are consistent for all your queries. If the p(95) was instead 1000 ms for example, then you would know that there are certain corner cases where your API's response time is nearly five times the average and you need to dig deep to cover these scenarios as well in your code.
Conclusion
Well there you go! You have successfully load tested your API or website. You have an insight into how your API or website performs today and be able to use this data to benchmark future releases.
k6 is a very powerful tool, with built in ways of running various types of tests, exporting metrics to different sources like Prometheus or AWS Cloudwatch and much more. Make sure to follow the Performance Testing With k6 series to learn about all the different features k6 has to offer.